
Spotify’s colorful graphics are taking all over the internet and netizens can’t have enough of them. When Spotify users turn to a new website, “Spotify Pie,” many are still wondering about how a Spotify Pie Chart works and how to make one. And why not? Who wouldn’t like to keep track of the kind of music that soothes one’s soul?
As the website claims, “Bake your Monthly Genre Pie,” getting your own graphic chart isn’t that technical. Spotify Pie is the graphic representation of the music you’ve listened to in a month, and not only this, but it also reflects the top artists listened to, all in a colorful colorful chart. Here’s all about the latest trend.
What Is A Spotify Pie Chart?
Spotify Wrapped may have arrived a few months ago, but fans have already tuned to a new website, that’s helping them keep track of their music preferences and a lot more. “Spotify Pie,” as obvious as the name goes, helps you analyze your Spotify data – particularly the genres Spotify users have listened to along with the top artists.
But that’s not all about it. Spotify users are drooling over the colorful chart that represents this data. The mastermind behind this creativity is UCLA student Darren Huang, who truly lived up to the website’s tagline, “Bake your monthly genre pie.”
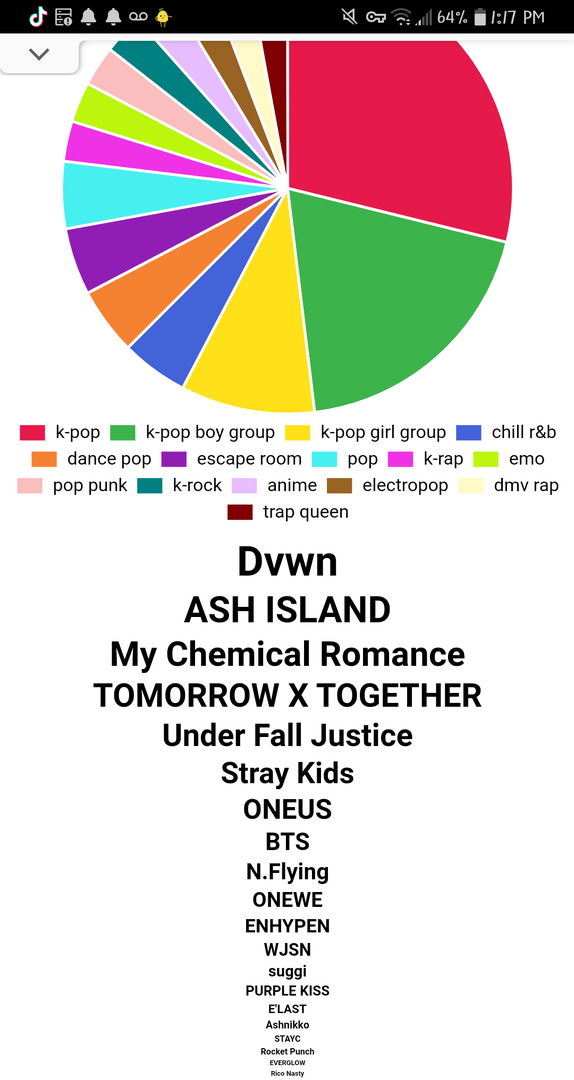
Spotify users can now see how Spotify categorizes each song into specific genres. For instance, from “metropolis”, “rock”, and “heavy metal”, to “underground hip-hop”, Spotify Pie has got you covered. Well, Twitter users cannot stop sharing their colorful pies, calling out their most bizarre genres, and judging others for their top artists.
Spotify Pie’s Got The Best Features!
One thing that the UCLA student took to the next level is this tool’s features. From gathering data from Spotify users’ music consumption to preparing a pie chart, representing their favorite genres in different colors, everything is a win-win about this tool.
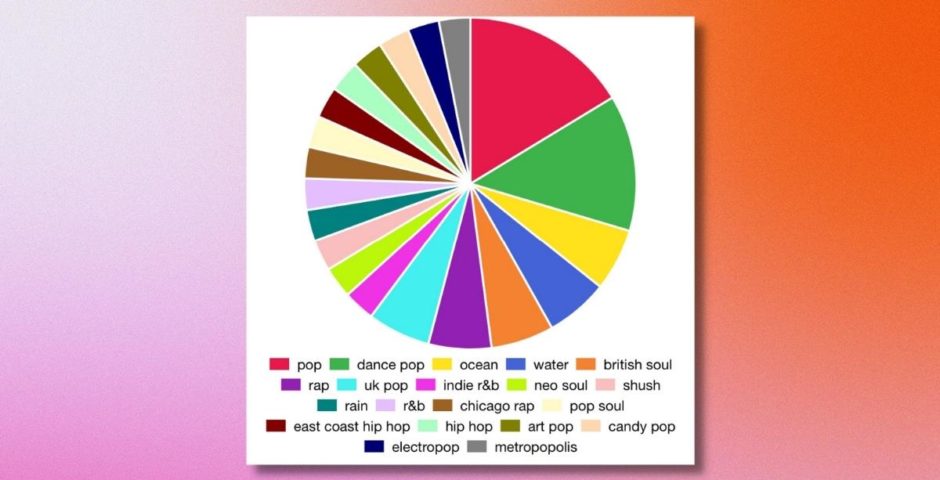
The different colors on the viral chart refer to different genres, and a legend underneath provides “which color corresponds to which genre”. And Huang didn’t get lazy here — he’s included a ton of different categories for the feature, like post-grunge, album-rock, Canadian metal rock, and much more. The legend shows colors, symbols, pattern, etc. using which the data is represented in the chart
Below the graph legend, users can find the artists they listen to most frequently. In fact, the order is from top to bottom, helping you understand your top artists. But here’s where things get even better. As opposed to Spotify Wrapped, Spotify Pie Chart can be updated on a monthly basis, doing every ounce of justice to the tagline, “Bake Your Monthly Genre Pie”.
How To Make A Spotify Pie Chart?
While every bit of this feature sounds fascinating, many people are still wondering about how to get a Spotify Pie Chart. Well, it isn’t rocket science. The third-party service can be accessed via Huang’s official website. Interestingly, the website is free to use and can be accessed on both, mobile and desktop.
In order to access your Spotify Pie Chart, you’ll be required to log in through Spotify and provide permission to the site to view your listening history. Thereafter, a colorful pie chart will be generated. You know the next step already, take a screenshot and flaunt it around! But hey, here are a few things to consider. The tool is incompatible with other streaming services, like Apple Music or Tidal.
How Does A Spotify Pie Looks Like?
Since the website came out, Spotify users are going nuts over this pie chart as they continue to share their monthly music history with friends. And yes, it’s a bit more fun as friends continue to judge and pull each other’s legs while sharing these colorful graphics.
A pie chart of everything I usually listen to on Spotify on any given month. pic.twitter.com/WtK6nZidqL
— Fuji (Commissions Open)🪷 (@fujifinite) June 4, 2022
One person shared his Spotify Pie Chart on Twitter, “A pie chart of everything I usually listen to on Spotify on any given month.” A Twitter user responded, “I guess we’re friends now.” Another wrote, “I am guessing this would change a lot for me a month to month because the stuff at the top is pretty recent obsessions.”
A pie chart of everything I usually listen to on Spotify on any given month. pic.twitter.com/WtK6nZidqL
— Fuji (Commissions Open)🪷 (@fujifinite) June 4, 2022
my pie chart wtf is russian plugg???? pic.twitter.com/LpaY1Id1QT
— Jaime 🇵🇭 (@nayeonfan160) June 7, 2022
Another curious Twitter user wrote, “my pie chart wtf is Russian plugg????” One mocked, “people really giving away their Spotify accounts.” One person even shared a link on how to set your Spotify Pie Chart.
More Places For Spotify Statistics
While Spotify Pie Chart sounds like the perfect deal, there are other third-party sites that analyze and visualize your listening history. Here are some of them: